Metrics
In addition to logs, you can have access to metrics to know how your application behaves. By default, system metrics like CPU and RAM use are available, as well as application-level metrics when available (apache or nginx status for instance).
Display metrics
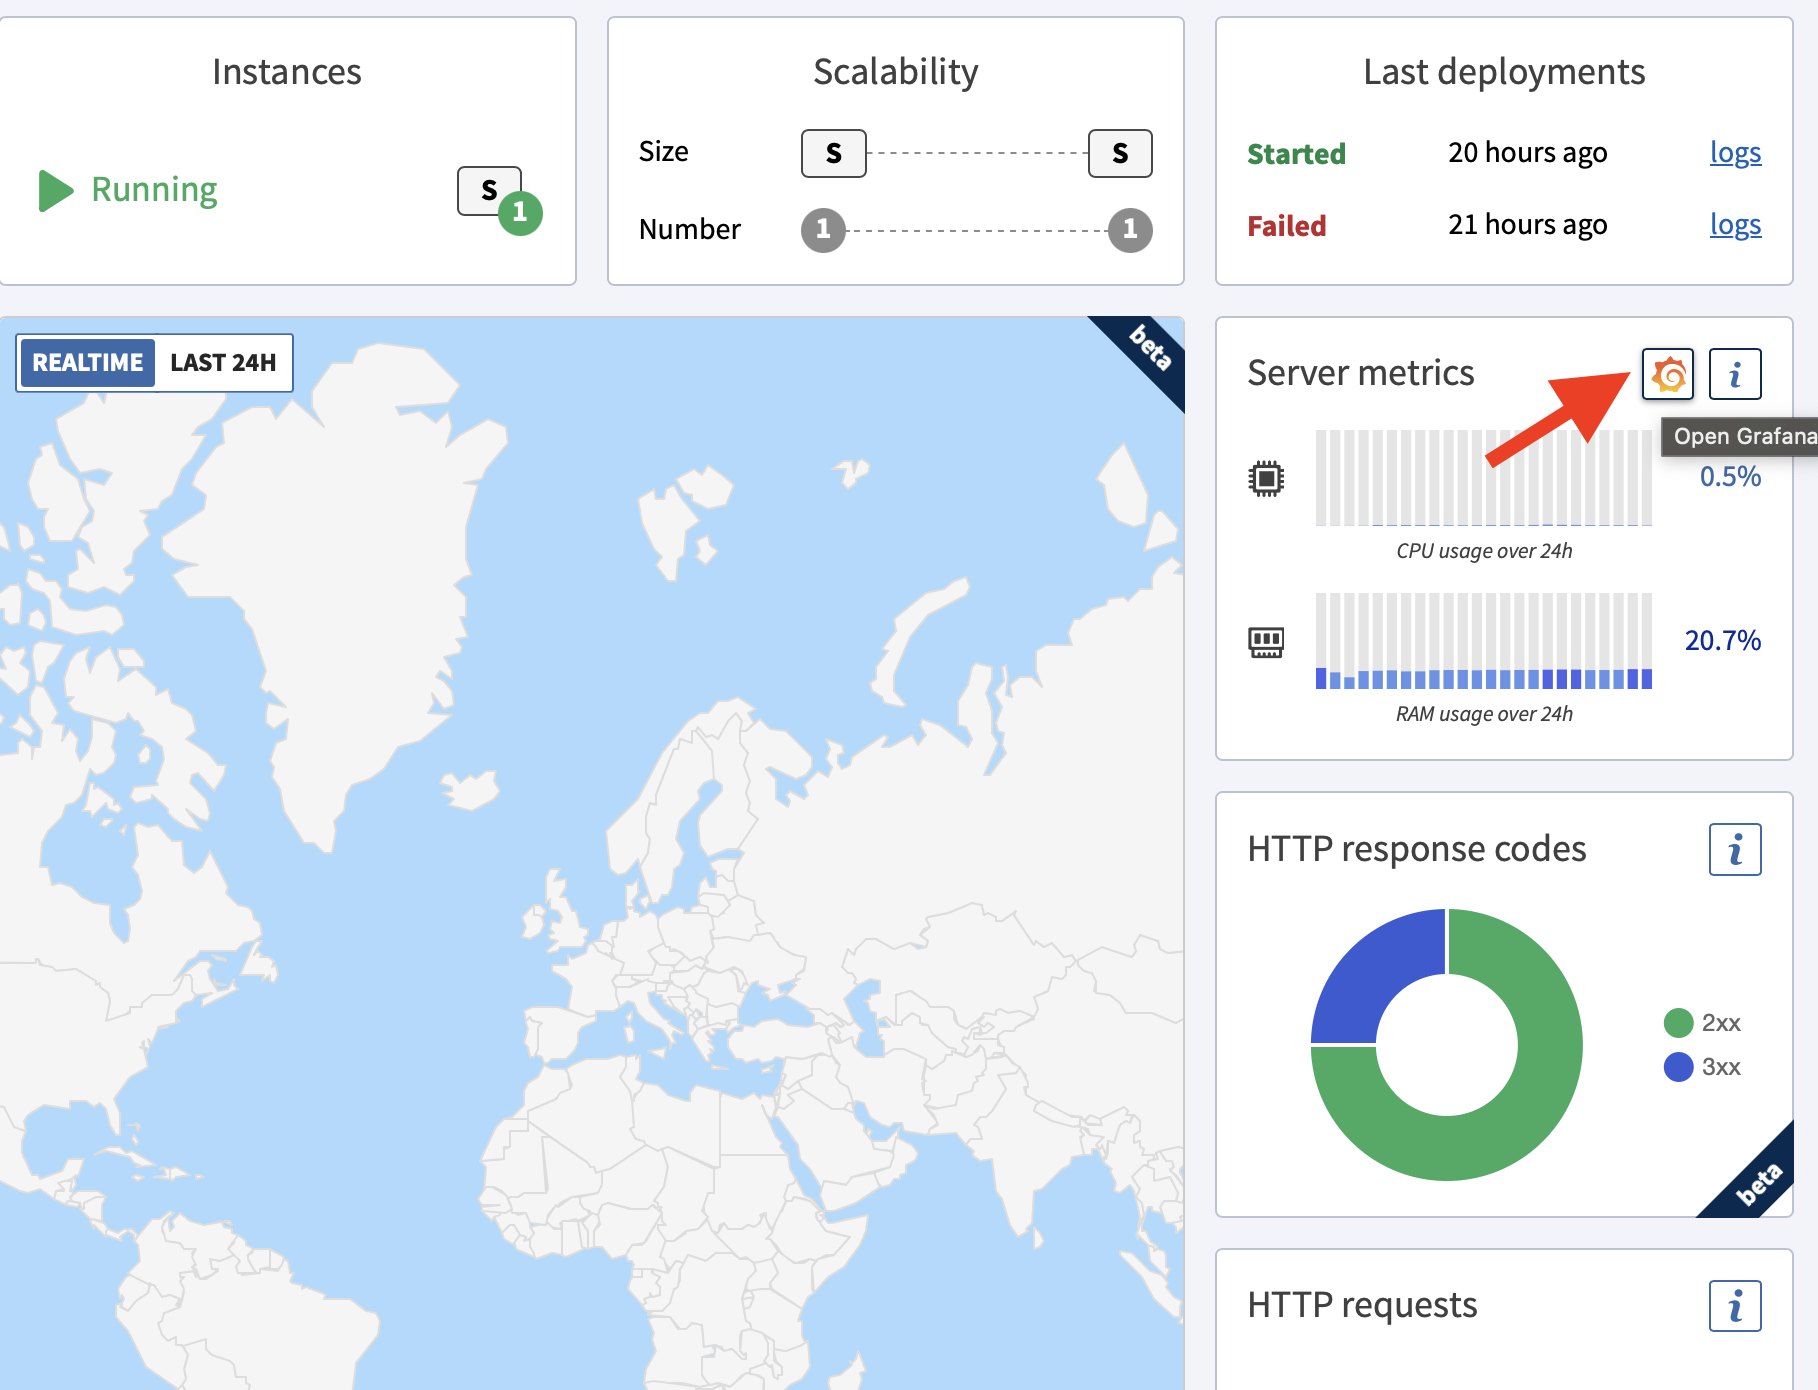
For each application, there is a Metrics tab in the console.
Overview pane
To get a quick overview of the current state of your scalers, the overview pane displays the current CPU, RAM, Disk and Network activity. On supported platforms, you can also have access to requests / second, and GC statistics.
Advanced pane
Advanced metrics allow you to access all gathered metrics, on a specified time range.
Custom queries
All metrics are stored in Warp 10, so you can explore data directly with the quantum interface, with WarpScript.
For instance, you can derive metrics over time, do custom aggregations or combine metrics.
Get alerts
You can set up alerts in Grafana to be notified on your apps and add-ons consumption. This can be useful to monitor databases capacity or latency.
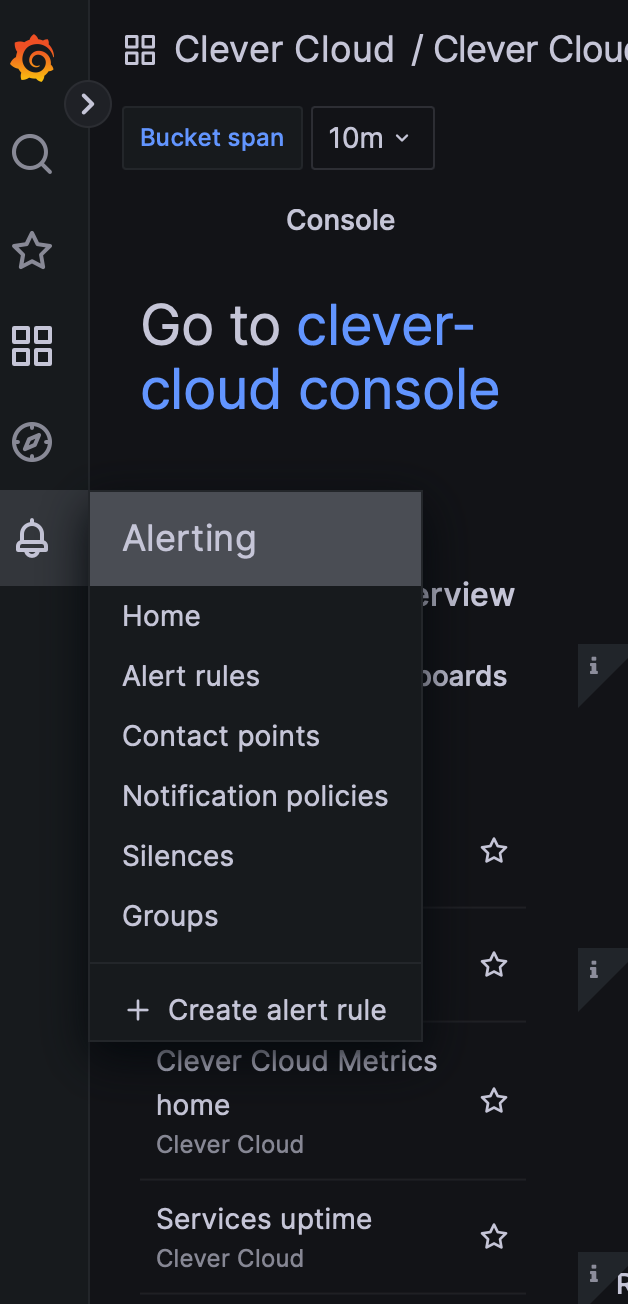
For example, check this tutorial on how to create Slack alerts with Grafana.
Templated dashboards in Grafana
Pre-configured dashboards are available in your Clever Cloud directory to help you visualize your application metrics.
To customize a template and preserve your changes, create and save a copy of the dashboard in a different directory. Original templates may be overwritten when the Clever Cloud team releases updates.
Monitoring’ metrics
All applications and VMs instances behind are monitored. Data is sent to Warp 10, a Geotimes series database. All metrics can be processed directly in the console in the Metrics tab of your applications or by the Clever Cloud Warp 10 endpoint.
Monitoring data model
All metrics data follow the same schema in warp 10. Each class represents a specific metric. The context is provided by the Warp 10 labels.
Class values and Labels
Overview
A telegraf daemon supplies most metrics.
Each metric is recorded as a Warp 10 class. Labels provide additional information about the VMs like instances id, organisation id, reverse proxy used.
Labels
In metrics’ data, mains labels would be :
owner_id: A unique ID by organisationapp_id: A unique ID of applicationhost: HV id hosting the VM instanceadc: Reverse proxy ID for http connexion (ie: applications)sdc: Reverse proxy ID for tcp connexion (ie: add-ons)vm_type:volatileorpersistent. Is it a stateless application or a stateful add-ondeployment_id: ID of the deployment
Classes
Telegraf provide lots of metrics described in their documentation.
Below, the list of all Warp 10 classes representing Telegraf metrics :
| Metric | Metric |
|---|---|
| conntrack.ip_conntrack_count | mem.swap_free |
| conntrack.ip_conntrack_max | mem.swap_total |
| cpu.usage_guest | mem.total |
| cpu.usage_guest_nice | mem.used |
| cpu.usage_idle | mem.used_percent |
| cpu.usage_iowait | mem.vmalloc_chunk |
| cpu.usage_irq | mem.vmalloc_total |
| cpu.usage_nice | mem.vmalloc_used |
| cpu.usage_softirq | mem.wired |
| cpu.usage_steal | mem.write_back |
| cpu.usage_system | mem.write_back_tmp |
| cpu.usage_user | net.bytes_recv |
| disk.free | net.bytes_sent |
| disk.inodes_free | net.drop_in |
| disk.inodes_total | net.drop_out |
| disk.inodes_used | net.err_in |
| disk.total | net.err_out |
| disk.used | net.packets_recv |
| disk.used_percent | net.packets_sent |
| http_response.http_response_code | net_response.response_time |
| http_response.response_time | net_response.result_code |
| http_response.result_code | net_response.result_type |
| http_response.result_type | netstat.tcp_close |
| kernel.boot_time | netstat.tcp_close_wait |
| kernel.context_switches | netstat.tcp_closing |
| kernel.entropy_avail | netstat.tcp_established |
| kernel.interrupts | netstat.tcp_fin_wait1 |
| kernel.processes_forked | netstat.tcp_fin_wait2 |
| mem.active | netstat.tcp_last_ack |
| mem.available | netstat.tcp_listen |
| mem.available_percent | netstat.tcp_none |
| mem.buffered | netstat.tcp_syn_recv |
| mem.cached | netstat.tcp_syn_sent |
| mem.commit_limit | netstat.tcp_time_wait |
| mem.committed_as | netstat.udp_socket |
| mem.dirty | processes.blocked |
| mem.free | processes.dead |
| mem.high_free | processes.idle |
| mem.high_total | processes.paging |
| mem.huge_page_size | processes.running |
| mem.huge_pages_free | processes.sleeping |
| mem.huge_pages_total | processes.stopped |
| mem.inactive | processes.total |
| mem.low_free | processes.total_threads |
| mem.low_total | processes.unknown |
| mem.mapped | processes.zombies |
| mem.page_tables | procstat_lookup.pid_count |
| mem.shared | system.load1 |
| mem.slab | system.load1_per_cpu |
| mem.swap_cached | jvm.statsd-jvm-profiler_heap_ps-old-gen_max.value |
| jvm.statsd-jvm-profiler_pending-finalization-count.value | jvm.statsd-jvm-profiler_nonheap_total_committed.value |
| jvm.statsd-jvm-profiler_loaded-class-count.value | jvm.metrics_jvm_heapMemoryUsage_used.value |
| jvm.statsd-jvm-profiler_gc_PS_Scavenge_count.value | jvm.metrics_jvm_nonHeapMemoryUsage_used.value |
| jvm.statsd-jvm-profiler_nonheap_metaspace_init.value | jvm.statsd-jvm-profiler_nonheap_total_used.value |
| jvm.statsd-jvm-profiler_heap_ps-survivor-space_used.value | jvm.statsd-jvm-profiler_heap_ps-eden-space_init.value |
| jvm.statsd-jvm-profiler_gc_PS_MarkSweep_time.value | jvm.statsd-jvm-profiler_nonheap_total_max.value |
| jvm.statsd-jvm-profiler_heap_ps-eden-space_max.value | jvm.statsd-jvm-profiler_nonheap_compressed-class-space_max.value |
| jvm.statsd-jvm-profiler_heap_total_init.value | jvm.statsd-jvm-profiler_nonheap_code-cache_used.value |
| jvm.statsd-jvm-profiler_nonheap_metaspace_used.value | jvm.statsd-jvm-profiler_nonheap_compressed-class-space_init.value |
| jvm.statsd-jvm-profiler_nonheap_metaspace_max.value | jvm.statsd-jvm-profiler_gc_PS_MarkSweep_count.value |
| jvm.statsd-jvm-profiler_heap_ps-eden-space_used.value |
Examples and usages
From the metrics tab on the console. You can either open a Quantum console, an online WarpScript editor, or either send your WarpScript by your own way on the Warp 10 endpoint (provided by Quantum).
More information about Quantum and Warp 10 in our documentation.
For example, you could fetch the memory usage of an application for the last hour. Smoothed by a data average by minute.
// Fix the NOW timestamp to have the same on over the script
NOW 'NOW' STORE
// fetch data over 1 hour
[ <READ TOKEN> 'mem.available' { 'app_id' '<APPLICATION ID>' } $NOW 1 h ] FETCH
// Average the data by bucket of 1 min from the last point timestamped at NOW
[ SWAP bucketizer.mean $NOW 1 m 0 ] BUCKETIZE
// From the instance granularity to application granularity. Timestamps to timestamps merge
[ SWAP [ 'app_id' ] reducer.mean ] REDUCE
Consumption metric
Consumption can also be inferred by our metrics. We provide some helper macros in the Warp 10 documentation.
Consumption unit is in second.
The following script provides the whole consumption from between start and end timestamps for all applications under an organisation.
'<READ TOKEN>' '<ORGANISATION ID>' <START TIMESTAMP> <END TIMESTAMP> @clevercloud/app_consumptionAdd-on storage metrics
FS Bucket
The storage used by each of your FS Bucket add-ons is recorded as the
fsbucket.storage class, with one data point per hour. The value is a size in bytes.
This metric belongs to the addon-api-fsbucket Warp 10 application, which is not included in the
read token shown in an application’s Metrics tab. Generate a token that includes it with
clever curl:
clever curl -X POST -H "Content-Type: application/json" \
  -d '{"applications": ["addon-api-fsbucket"], "ttl": "P5D"}' \
  https://api.clever-cloud.com/v4/stats/organisations/<ORGANISATION ID>/tokens/read
ttl controls how long the token remains valid, not how far back it can query. It is an
ISO 8601 duration and cannot exceed P20D,
which represents a period of 20 days. The token is returned in the token field of the response.
Save the following WarpScript as fsbucket.mc2, replacing
the token and organisation ID with your values. It retrieves the storage used by every bucket of
the organisation over the last 30 days:
[ '<READ TOKEN>' 'fsbucket.storage' { 'owner_id' '<ORGANISATION ID>' } NOW 30 d ] FETCHSend it to the Clever Cloud Warp 10 endpoint:
curl --data-binary @fsbucket.mc2 \
  https://c2-warp10-clevercloud-customers.services.clever-cloud.com/api/v0/exec
The API returns a Geo Time Series for each bucket, with its owner, ID, datacenter and storage server as labels. A simplified response follows this structure:
[
  [
    {
      "c": "fsbucket.storage",
      "l": {
        ".app": "addon-api-fsbucket",
        "owner_id": "<ORGANISATION_ID>",
        "app_id": "<BUCKET_ID>",
        "datacenter": "<DATACENTER>",
        "server_id": "<STORAGE_SERVER_ID>"
      },
      "a": {},
      "v": [
        [1787677200000000, 1048576]
      ]
    }
  ]
]
Each entry in v contains a timestamp in microseconds followed by the storage used in bytes. The
owner ID starts with orga_, or user_ for a personal organisation. Bucket IDs start with
bucket_, or app_ for buckets created before the naming change. Datacenter values are not
case-normalised: both PAR and par exist in the data. Prefer not to filter on that label, or
match it case-insensitively.
To return the total storage used by every bucket, aggregated hourly, append these operations after
FETCH in fsbucket.mc2:
// Group points into one-hour buckets and keep the last value in each bucket
[ SWAP bucketizer.last NOW 1 h 0 ] BUCKETIZE

// Sum all bucket series at matching timestamps
[ SWAP [] reducer.sum ] REDUCE
To follow a single bucket, replace the labels in fsbucket.mc2 with:
{ 'owner_id' '<ORGANISATION ID>' 'app_id' '<BUCKET ID>' }Publish your own metrics
We currently support two ways to push / collect your metrics: the statsd protocol and prometheus.
The statsd server listens on port 8125. You can send metrics using regular statsd protocol or using an advanced one as described here.
We also support Prometheus metrics collection, by default our agent collects exposed metrics on localhost:9100/metrics.
If needed, you can override those settings with the two following environment variables:
CC_METRICS_PROMETHEUS_PORT: Define the port on which the Prometheus endpoint is availableCC_METRICS_PROMETHEUS_PATH: Define the path on which the Prometheus endpoint is available
As with Prometheus the exposed host can be the same as the application deployed, you can use a basic authentication to collect the metrics with the two following environment variables:
CC_METRICS_PROMETHEUS_USER: Define the user for the basic auth of the Prometheus endpointCC_METRICS_PROMETHEUS_PASSWORD: Define the password for the basic auth of the Prometheus endpoint
For large custom set of metrics to collect, the default response timeout of the /metrics query is 3 seconds. You can update it with the following environment variable:
CC_METRICS_PROMETHEUS_RESPONSE_TIMEOUT: Define the timeout in seconds to collect the application metrics. This value must be below 60 seconds as data are collected every minutes.
To access your metrics from Warp10 you need to use the prefix prometheus. or statsd. based on what you used to publish your metrics.
You can use this query to show all collected metrics:
[
  'TOKEN'
  '~prometheus.*'
  { 'app_id' 'app_xxxxxxxx' }
  NOW 5 m
]
FETCH
Node.js example
You can use node-statsd to publish metrics:
// npm install node-statsd

const StatsD = require("node-statsd"),
  client = new StatsD();

// Increment: Increments a stat by a value (default is 1)
client.increment("my_counter");

// Gauge: Gauge a stat by a specified amount
client.gauge("my_gauge", 123.45);
Haskell example
In Haskell, metrics are usually gathered with EKG.
The package ekg-statsd allows to push EKG metrics over statsd.
If you’re using warp, you can use
wai-middleware-metrics to report request distributions (request count,
responses count aggregated by status code,
responses latency distribution).
EKG allows you to have access to GC metrics, make sure you compile your application
with "-with-rtsopts=-T -N" to enable profiling.
{-# LANGUAGE OverloadedStrings #-}

-- you need the following packages
-- ekg-core
-- ekg-statsd
-- scotty
-- wai-middleware-metrics

import           Control.Monad                   (when)
import           Network.Wai.Metrics             (WaiMetrics, metrics,
                                                  registerWaiMetrics)
import           System.Metrics                  (newStore, registerGcMetrics)
import           System.Remote.Monitoring.Statsd (defaultStatsdOptions,
                                                  forkStatsd)
import           Web.Scotty

handleMetrics :: IO WaiMetrics
handleMetrics = do
  store <- newStore
  registerGcMetrics store
  waiMetrics <- registerWaiMetrics store
  sendMetrics <- maybe False (== "true") <$> lookupEnv "ENABLE_METRICS"
  when sendMetrics $ do
    putStrLn "statsd reporting enabled"
    forkStatsd defaultStatsdOptions store
    return ()
  return waiMetrics

main = do
  waiMetrics <- handleMetrics
  scotty 8080 $ do
     middleware $ metrics waiMetrics
     get "/" $
       html $ "Hello world"